Measuring Pump Capacity by Drawdown, and the Inflow Correction
The Problem
Most lift stations don't have a flowmeter on the discharge, so during startup — or years later, when a pump seems tired — the question “how much is this pump actually moving?” has no gauge to answer it. The wet well itself is the meter. If you know its plan area and time how fast the level drops with the pump running, area times drop over time is a flow. The system-curve plotter tells you where a pump should run; this measures where it does.
The Approach
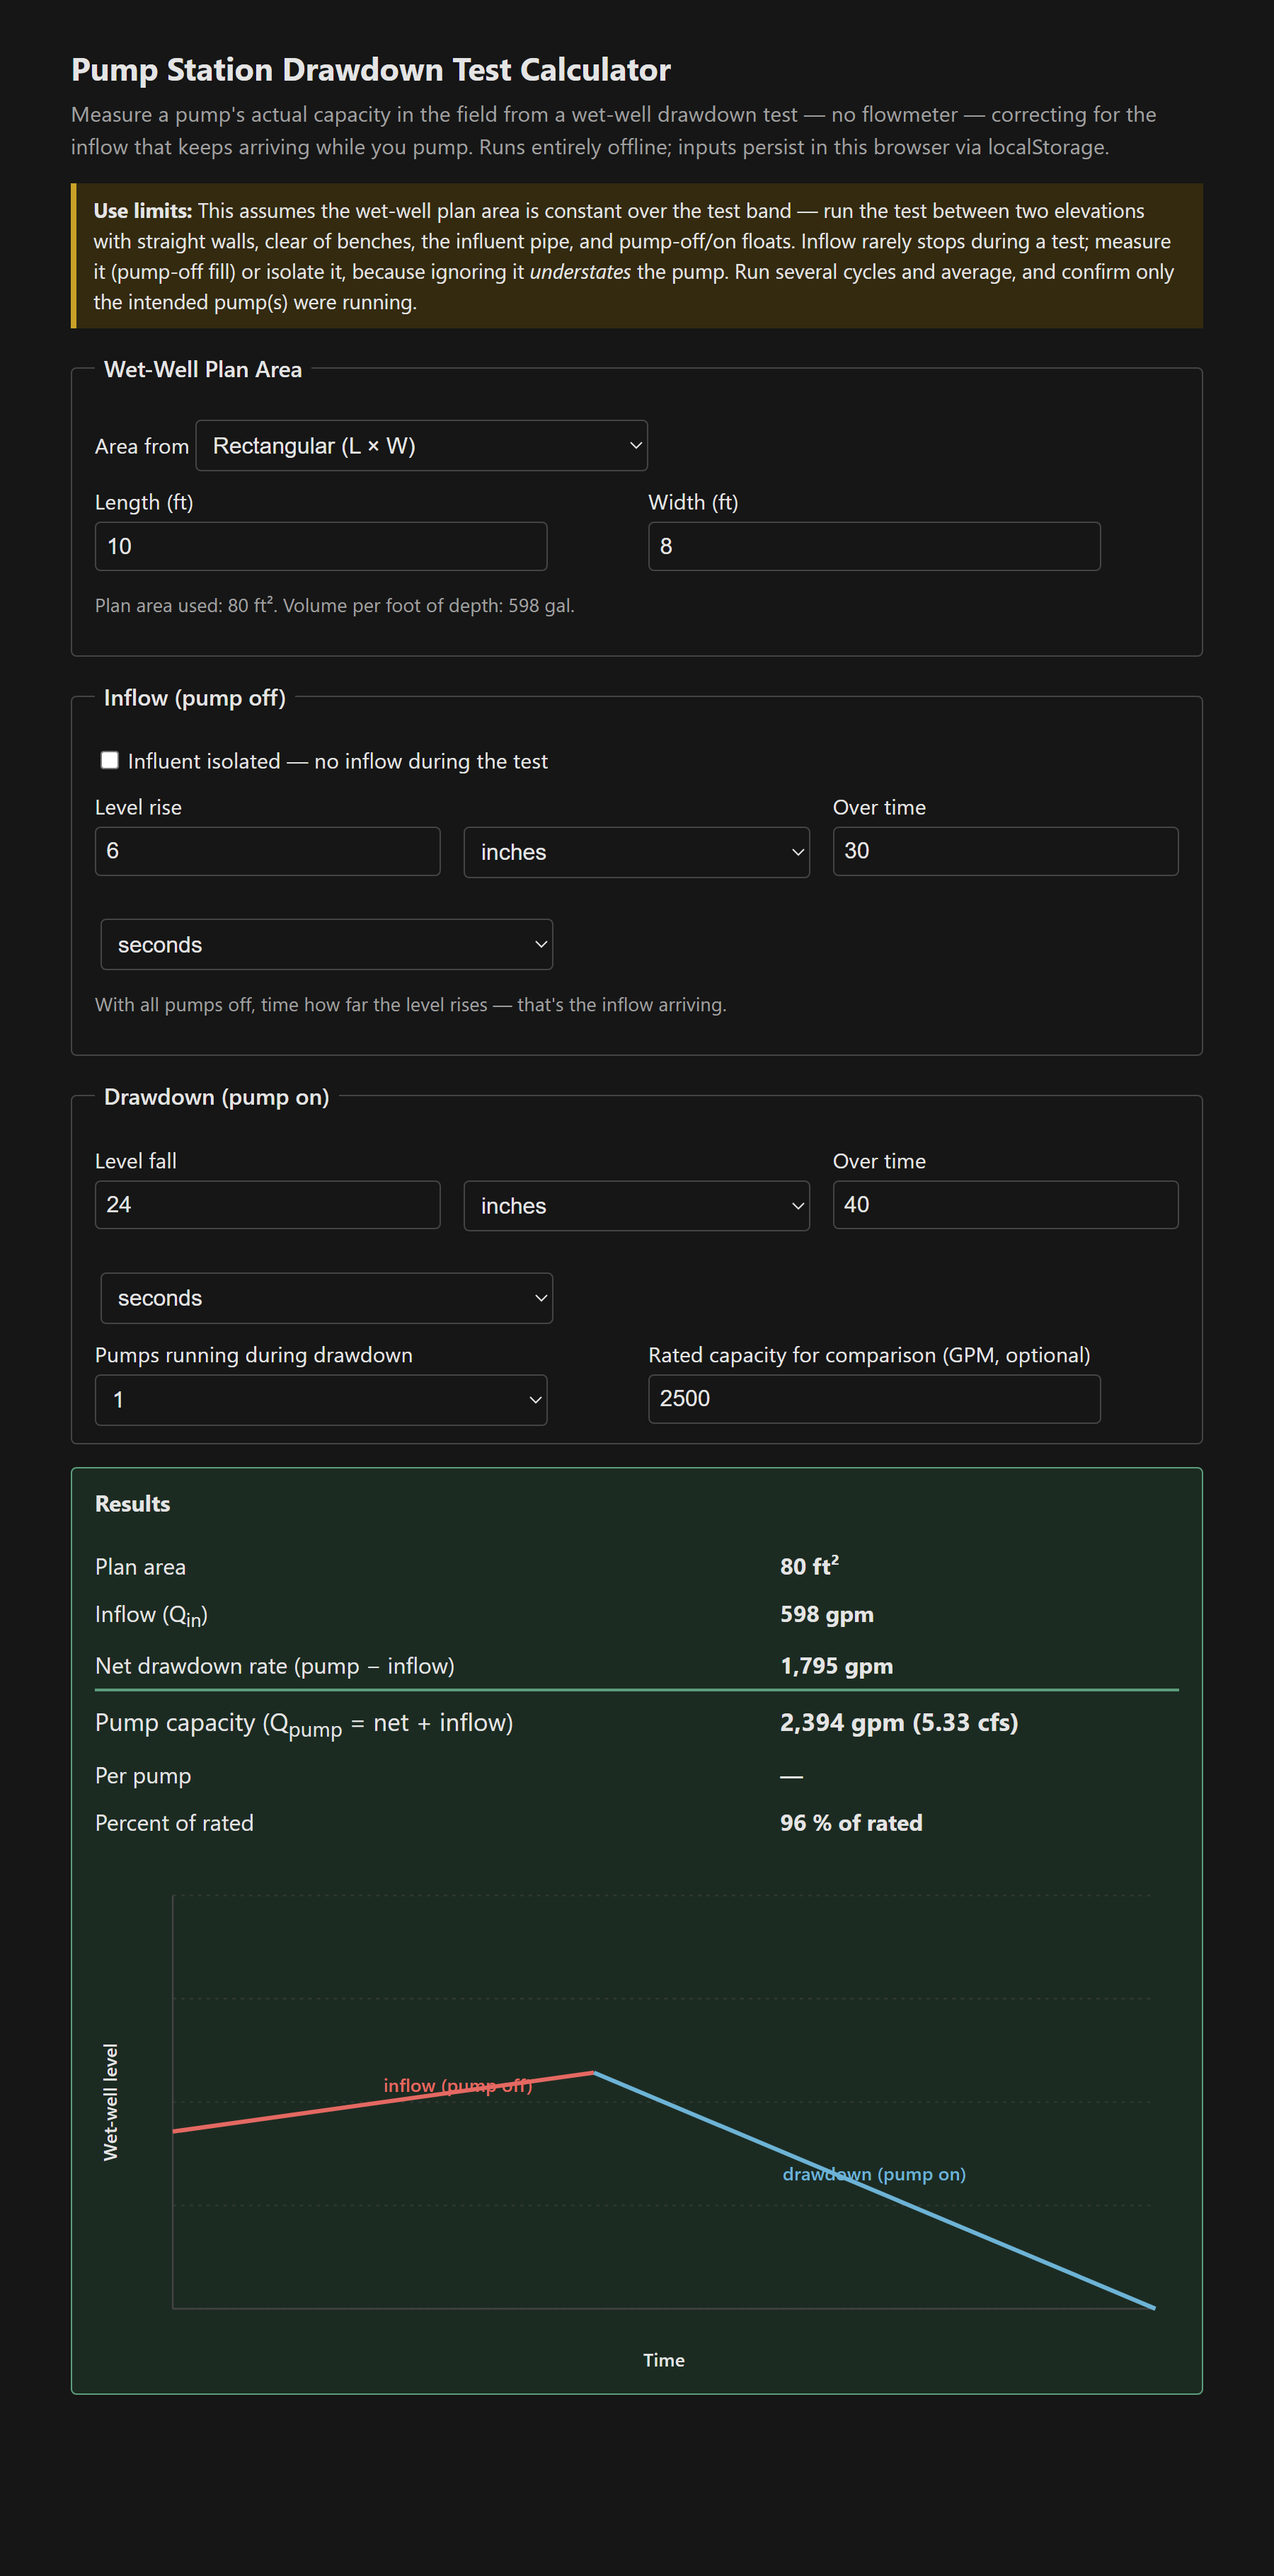
The arithmetic is just Q (gpm) = 7.48 · A (ft²) · d (ft) / t (min) — area times level change is a volume, over the time it took, with 7.48 converting cubic feet to gallons. You give the tool the wet-well area (directly, or from length×width or a diameter), the inflow, and the drawdown, in whatever units you read in the field (inches and seconds, or feet and minutes). It plots the level trace — the level rising while the pump is off, then falling once it kicks on — and reports the capacity.
The inflow correction is the whole trick
The mistake that quietly understates every drawdown test is forgetting that the sewage keeps coming. While the pump draws the well down, inflow is still arriving, so the level falls slower than the pump is really moving water — and the naive “area times drop over time” gives you the net, not the pump. In the worked example the pump is actually a 2,394 gpm machine, but the well only dropped at a rate of 1,795 gpm because ~600 gpm of inflow was refilling it the whole time. Measure that inflow first (pumps off, time the rise), and the pump capacity is the net drawdown plus the inflow. Isolate the influent instead and the inflow term is zero — but on a live station you usually can't, so you measure it.
Getting a trustworthy number
- Constant plan area is the load-bearing assumption. Benched wells, the influent invert, and fillets change the area with depth — test between two elevations where the walls are vertical and uniform.
- Keep the test band clear of the pump-off and pump-on setpoints so the controls don't cycle the pump mid-measurement.
- Run three or more drawdowns and average; a single stopwatch read on a fast pump — and the smaller inflow read especially — is noisy.
- If the measured capacity looks low, check the actual operating head before you blame the pump: a higher-than-rated head lowers flow legitimately, exactly as the pump curve predicts.
It's a single static file, vanilla JS, everything persisted in localStorage and nothing leaving the browser. Pairs with the wet-well cycle-time calculator for the other half of a lift-station commissioning.
The tool: Pump Station Drawdown Test Calculator.
References
- [1] Recommended Standards for Wastewater Facilities (“Ten-State Standards”) — pump station testing.
- [2] Companion tools: wet well cycle time and the pump system-curve plotter.