Finding the Pump Operating Point, and Why Parallel Pumps Don't Double Flow
The Problem
A pump doesn't run where the catalog says it does; it runs where its curve crosses the system's. The manufacturer gives you head versus flow, the piping gives you a static lift plus friction that climbs with flow, and the pump settles at the one flow where those two are equal. It's the most fundamental picture in pumping and the one most often left as two separate PDFs. I wanted to draw both curves on the same axes and mark the intersection.
The Approach
You read four to six points off the manufacturer's head-capacity curve — including shutoff (zero flow) and a far-right point — and the tool least-squares fits a quadratic, H = a + bQ + cQ², through them. The system curve is Hstatic + K·Qn, with K backed out from one design point (a flow and its friction head) and n either 2 (Darcy) or 1.85 (Hazen-Williams). Since the pump head falls and the system head rises, there's exactly one intersection when the pump can beat the static lift, and the tool bisects to it.
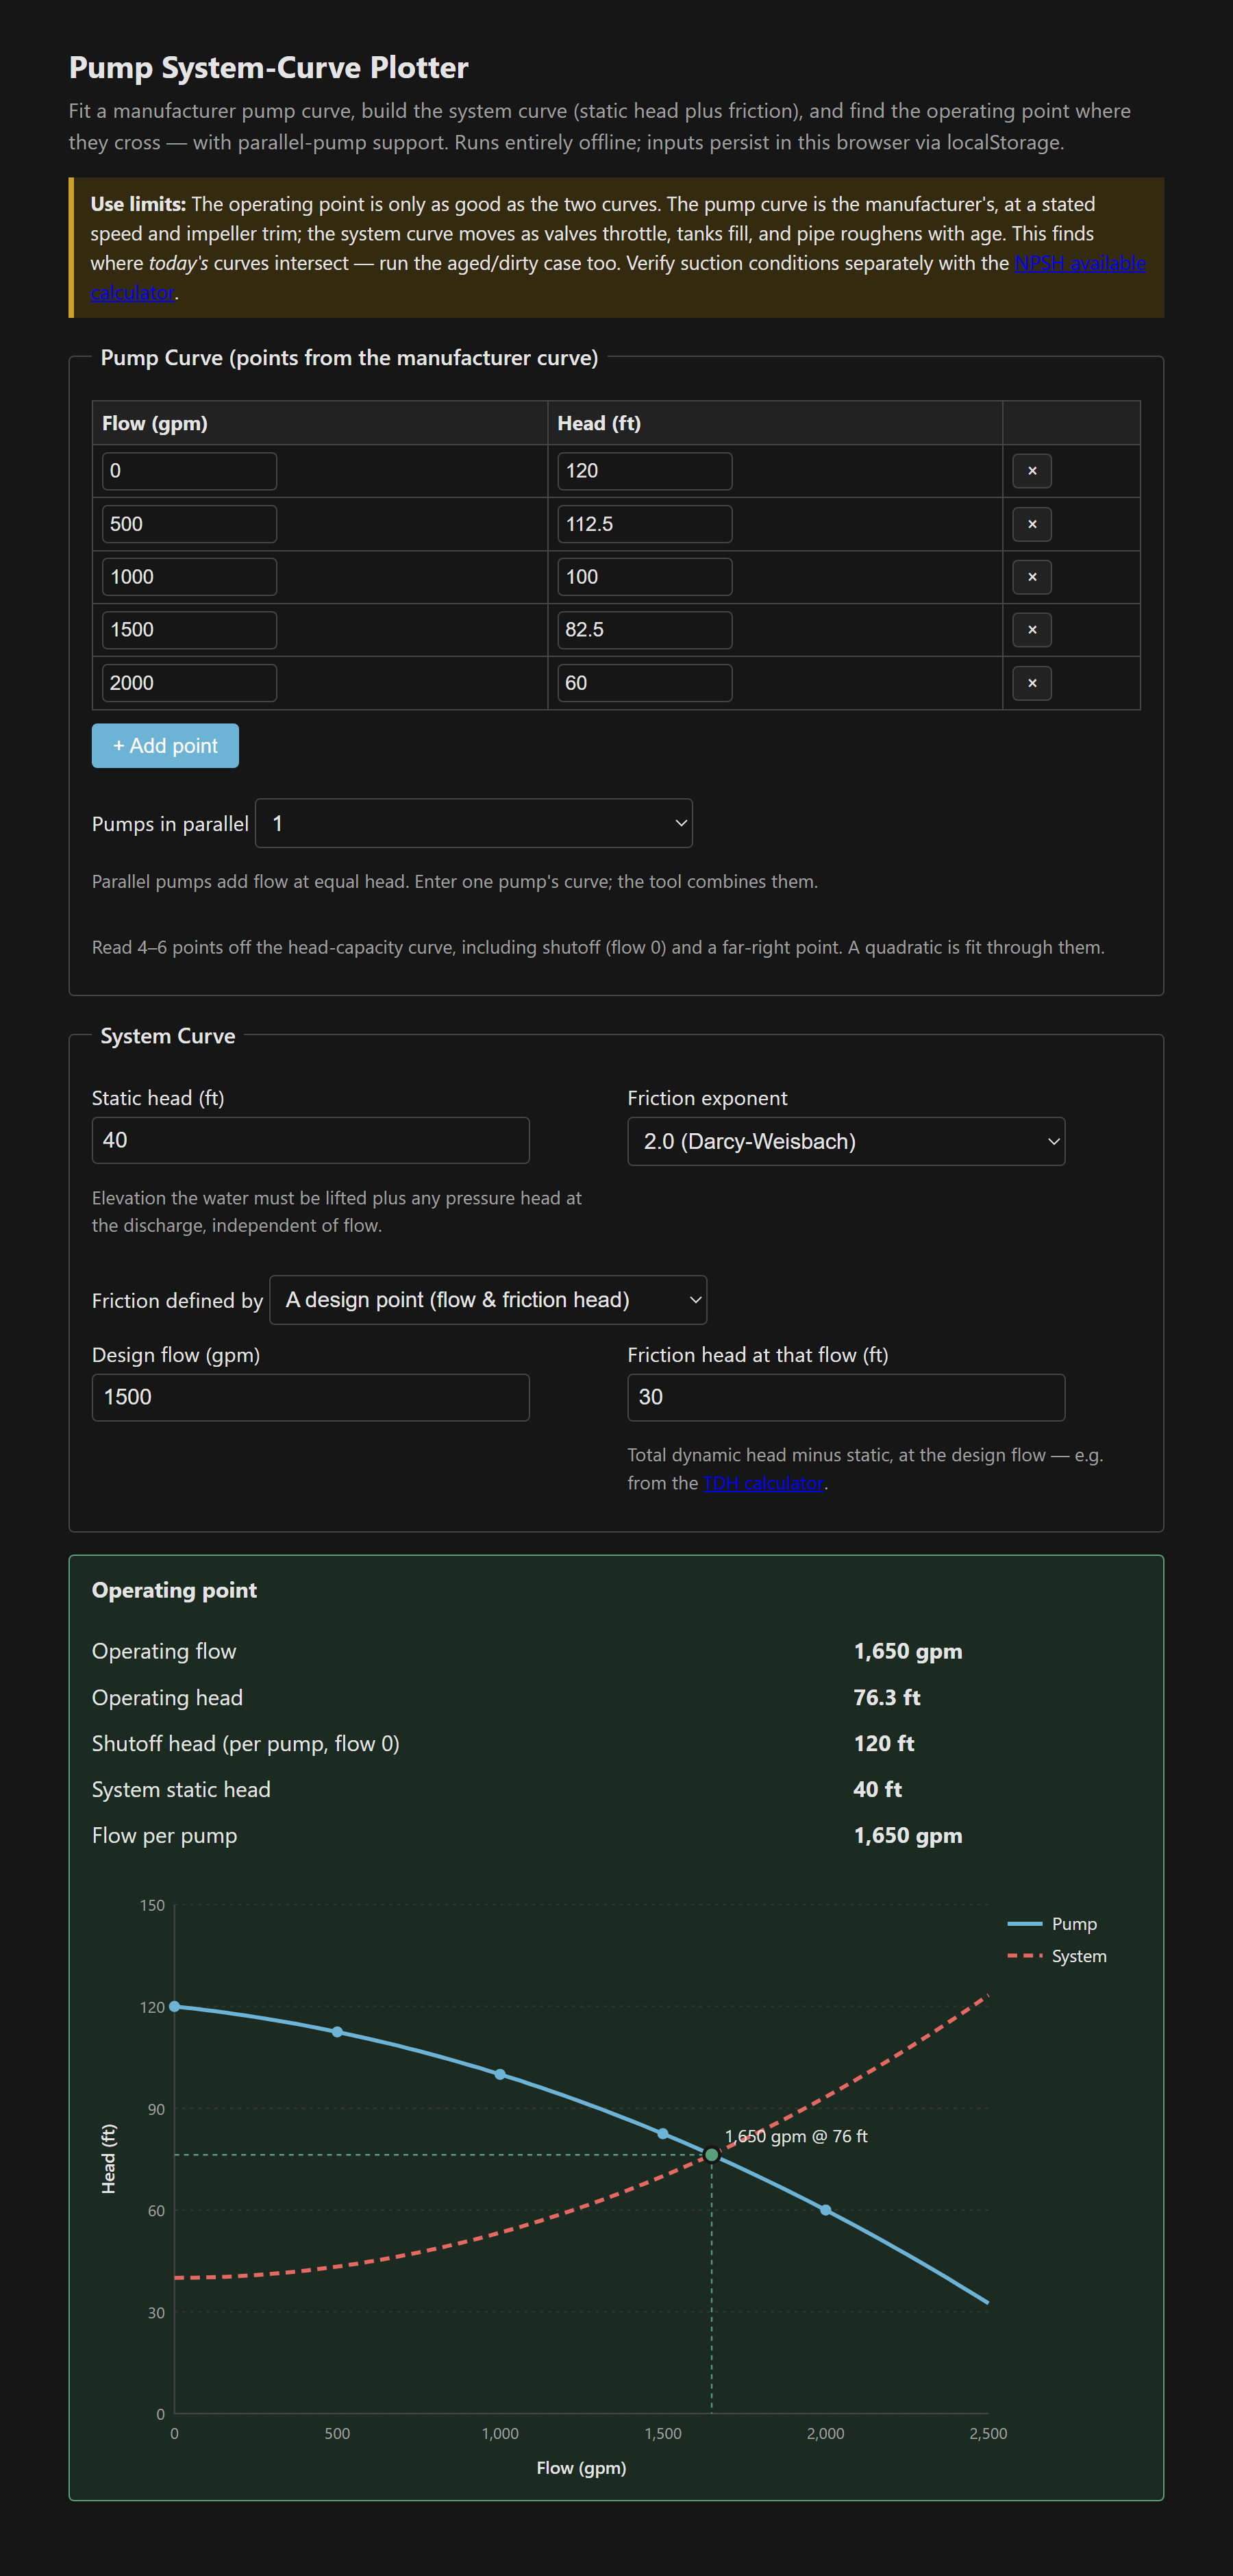
Parallel pumps never double the flow
The feature I find most worth seeing is what happens with pumps in parallel. Parallel pumps add flow at equal head, so two identical pumps make a combined curve that carries twice the flow at any given head. The intuition is “two pumps, twice the water” — and it's wrong, because the system curve climbs steeply with flow. Push more flow and friction rises as its square, so the operating point slides up a stiffening system curve. In the worked example, the second pump takes flow from about 1,650 to 2,100 gpm — a 27% gain, not 100%. The plot shows you the actual number for your system, which is the difference between a lead-lag pair that helps and one that mostly just burns power and beats itself up.
Reading the operating point like a pump curve
- The manufacturer curve is for one speed and impeller diameter. Trim the impeller or add a VFD and it shifts — scale it with the affinity laws first, then intersect.
- Run the system curve twice: clean and new (low K), then aged and throttled (high K). The operating point walks left up the pump curve as the system stiffens, often into a worse-efficiency, higher-vibration zone.
- An operating point far right of best-efficiency (flat system, oversized pump) risks cavitation and motor overload; far left risks recirculation. Confirm it lands near BEP, and check the suction side separately with the NPSH available tool.
- The friction head for the design point comes from a real head-loss calc — the total dynamic head calculator gives it directly.
It's the usual shape: one static file, vanilla JS, the quadratic fit and the intersection solved in a few microseconds, everything persisted in localStorage and nothing leaving the browser.
The tool: Pump System-Curve Plotter.
References
- [1] Hydraulic Institute / pump handbooks — head-capacity and system-head curves, and parallel operation.
- [2] Companion tools: pump affinity laws, NPSH available, and total dynamic head.