Building a Stage-Storage-Discharge Curve, the Input to Routing
The Problem
Detention basin design has a preliminary-volume step and a final-routing step, and the thing that connects them is a table people rarely draw by hand anymore: the stage-storage-discharge relationship. At each water-surface elevation, how much water is stored and how much is leaving? Storage comes from the basin's geometry; discharge comes from the outlet hydraulics; and the routing software wants both, tabulated against stage. I wanted a tool that builds that table honestly and plots it, without pretending to be the routing itself.
The Approach
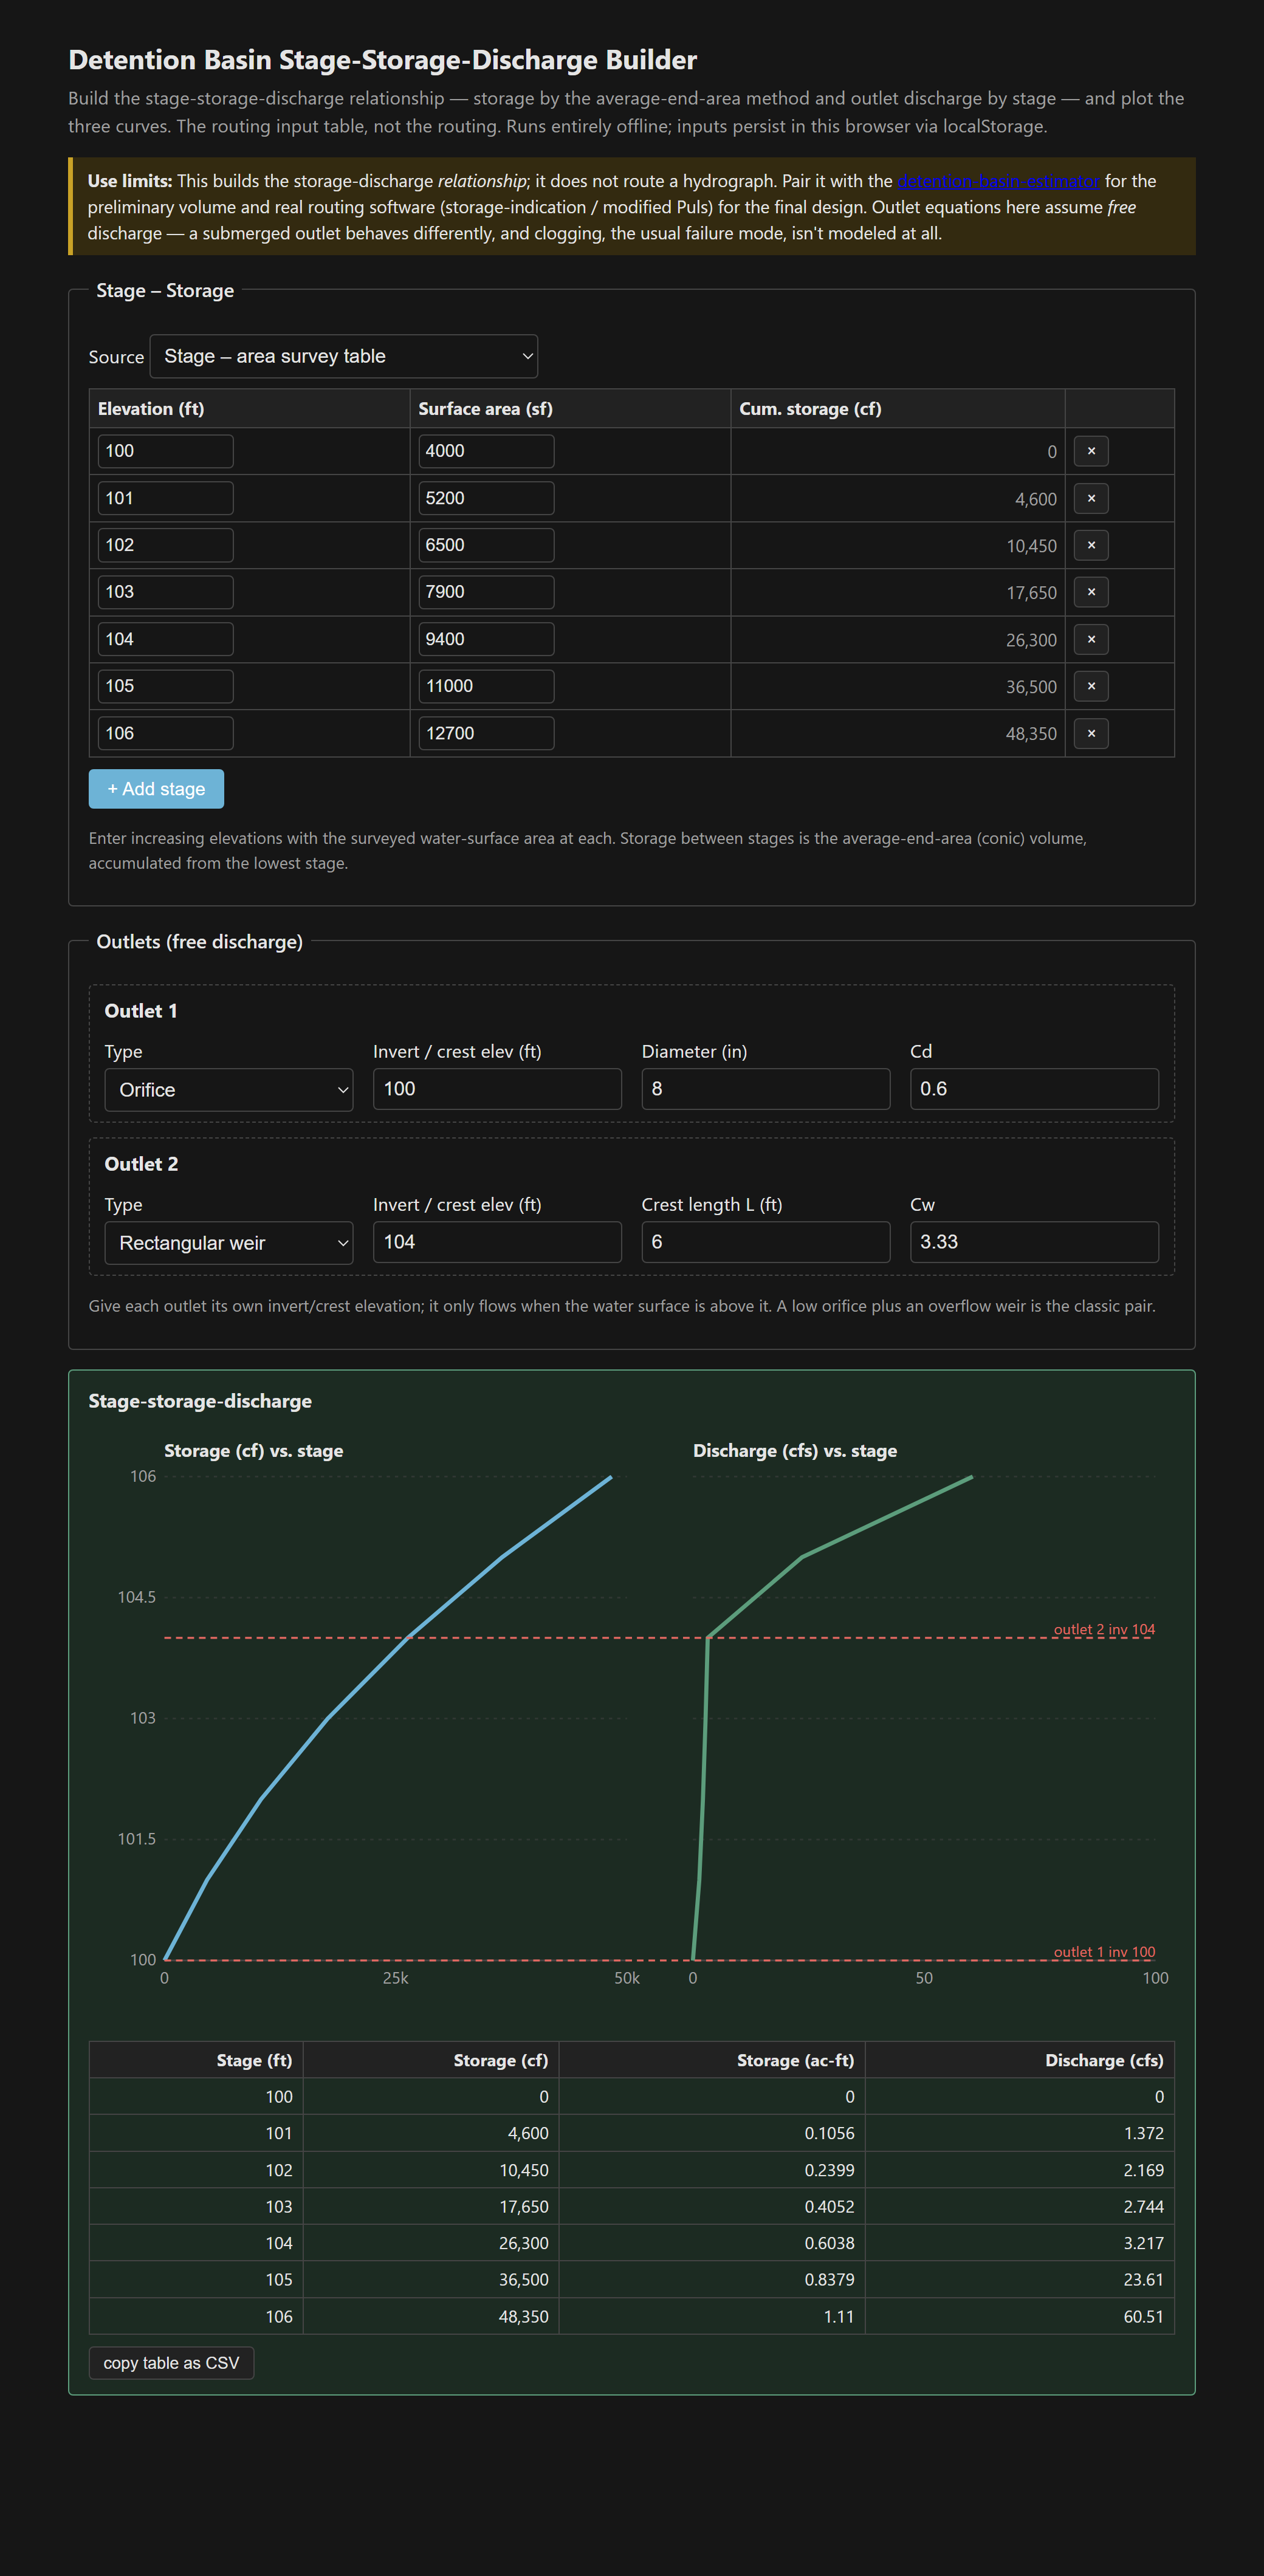
Storage is built by the average-end-area (conic) method from a stage-area survey: between two elevations with surface areas A1 and A2 a distance Δh apart, the incremental volume is (A1 + A2)/2 · Δh, accumulated from the bottom. Discharge is computed at each stage from up to two outlets — an orifice by Cd·A·√(2gh), a weir by Cw·L·h^1.5 — each with its own invert, so it only contributes above its own elevation. The two curves plot side by side on a shared elevation axis, with the outlet inverts drawn as reference lines, and the table exports as CSV for the routing model.
The two-outlet step, and why this isn't routing
The most instructive feature is the kink in the discharge curve. Below the weir crest at elevation 104, only the low orifice is flowing, and it grows slowly as the square root of head. Cross 104 and the weir opens up, discharge climbing as head to the 1.5 power, and the curve bends hard upward — the classic low-flow-orifice / high-flow-overflow pairing that keeps the small storms attenuated and passes the big ones safely. But notice what the tool does not do: it never routes an inflow hydrograph through this relationship. That's the storage-indication (modified Puls) step, which marches a storm through the 2S/Δt + Q function this table feeds. Building the relationship and routing it are two jobs, and conflating them is how people talk themselves into thinking a spreadsheet sized a basin.
Where the accuracy actually lives
- Average-end-area slightly overestimates storage for a concave bowl — acceptable for planning, and the stage-area survey is the real accuracy limiter, not the integration method.
- The outlet equations assume free discharge. If downstream tailwater can rise above an outlet, it transitions from weir to orifice behavior and the free-discharge numbers overstate flow — the tool warns on outlet arrangements where that's a risk.
- Clogging is the unmodeled failure mode. Trash racks, a minimum orifice size, and a factor of safety on the primary outlet handle it — in the details, not the hydraulics.
- Pair this with the detention-basin-estimator for the first-cut volume and the weir & orifice tool for a single-structure check.
The output is the routing input table: stage, cumulative storage in cubic feet and acre-feet, and total discharge, ready to copy into the model. Single file, vanilla JS, everything persisted in localStorage and nothing leaving the browser.
The tool: Detention Basin Stage-Storage-Discharge Builder.
References
- [1] The detention-basin-estimator (preliminary volume) and weir & orifice flow tools.
- [2] The local hydrology / drainage design manual — governing outlet coefficients, freeboard, and routing requirements.
- [3] Reservoir routing references — the storage-indication (modified Puls) method, e.g. NRCS TR-55 / TR-20 and HEC-HMS documentation.