CT Compliance, T10, and Why Peak Flow Governs Disinfection
The Problem
CT compliance under the Surface Water Treatment Rule is a small ratio wrapped around two numbers that are easy to get subtly wrong. CT-achieved is residual concentration times contact time; CT-required is a value from a regulatory table. The trap is that both the “time” and the “required” hide assumptions — the time is not the tank's theoretical detention time, and the required value is a specific cell in a table that swings steeply with temperature and pH. I wanted a calculator that does the ratio honestly without pretending to know your table cell for you.
The Approach
Each disinfection segment gets a row: contact volume, peak flow, a baffling factor, the measured residual, and the CT-required you read from the governing table. The tool computes T10 = (volume ÷ peak flow) × baffling, then CT-achieved = C · T10, then the ratio against your entered CT-required. Sequential segments add their ratios, and compliance needs the sum to reach 1.0. The effective log inactivation is the log target times that sum. Deliberately, the CT tables are not embedded — the conditions fields (disinfectant, temperature, pH, residual) exist only to make sure you pull the right cell and to put those conditions on the printout.
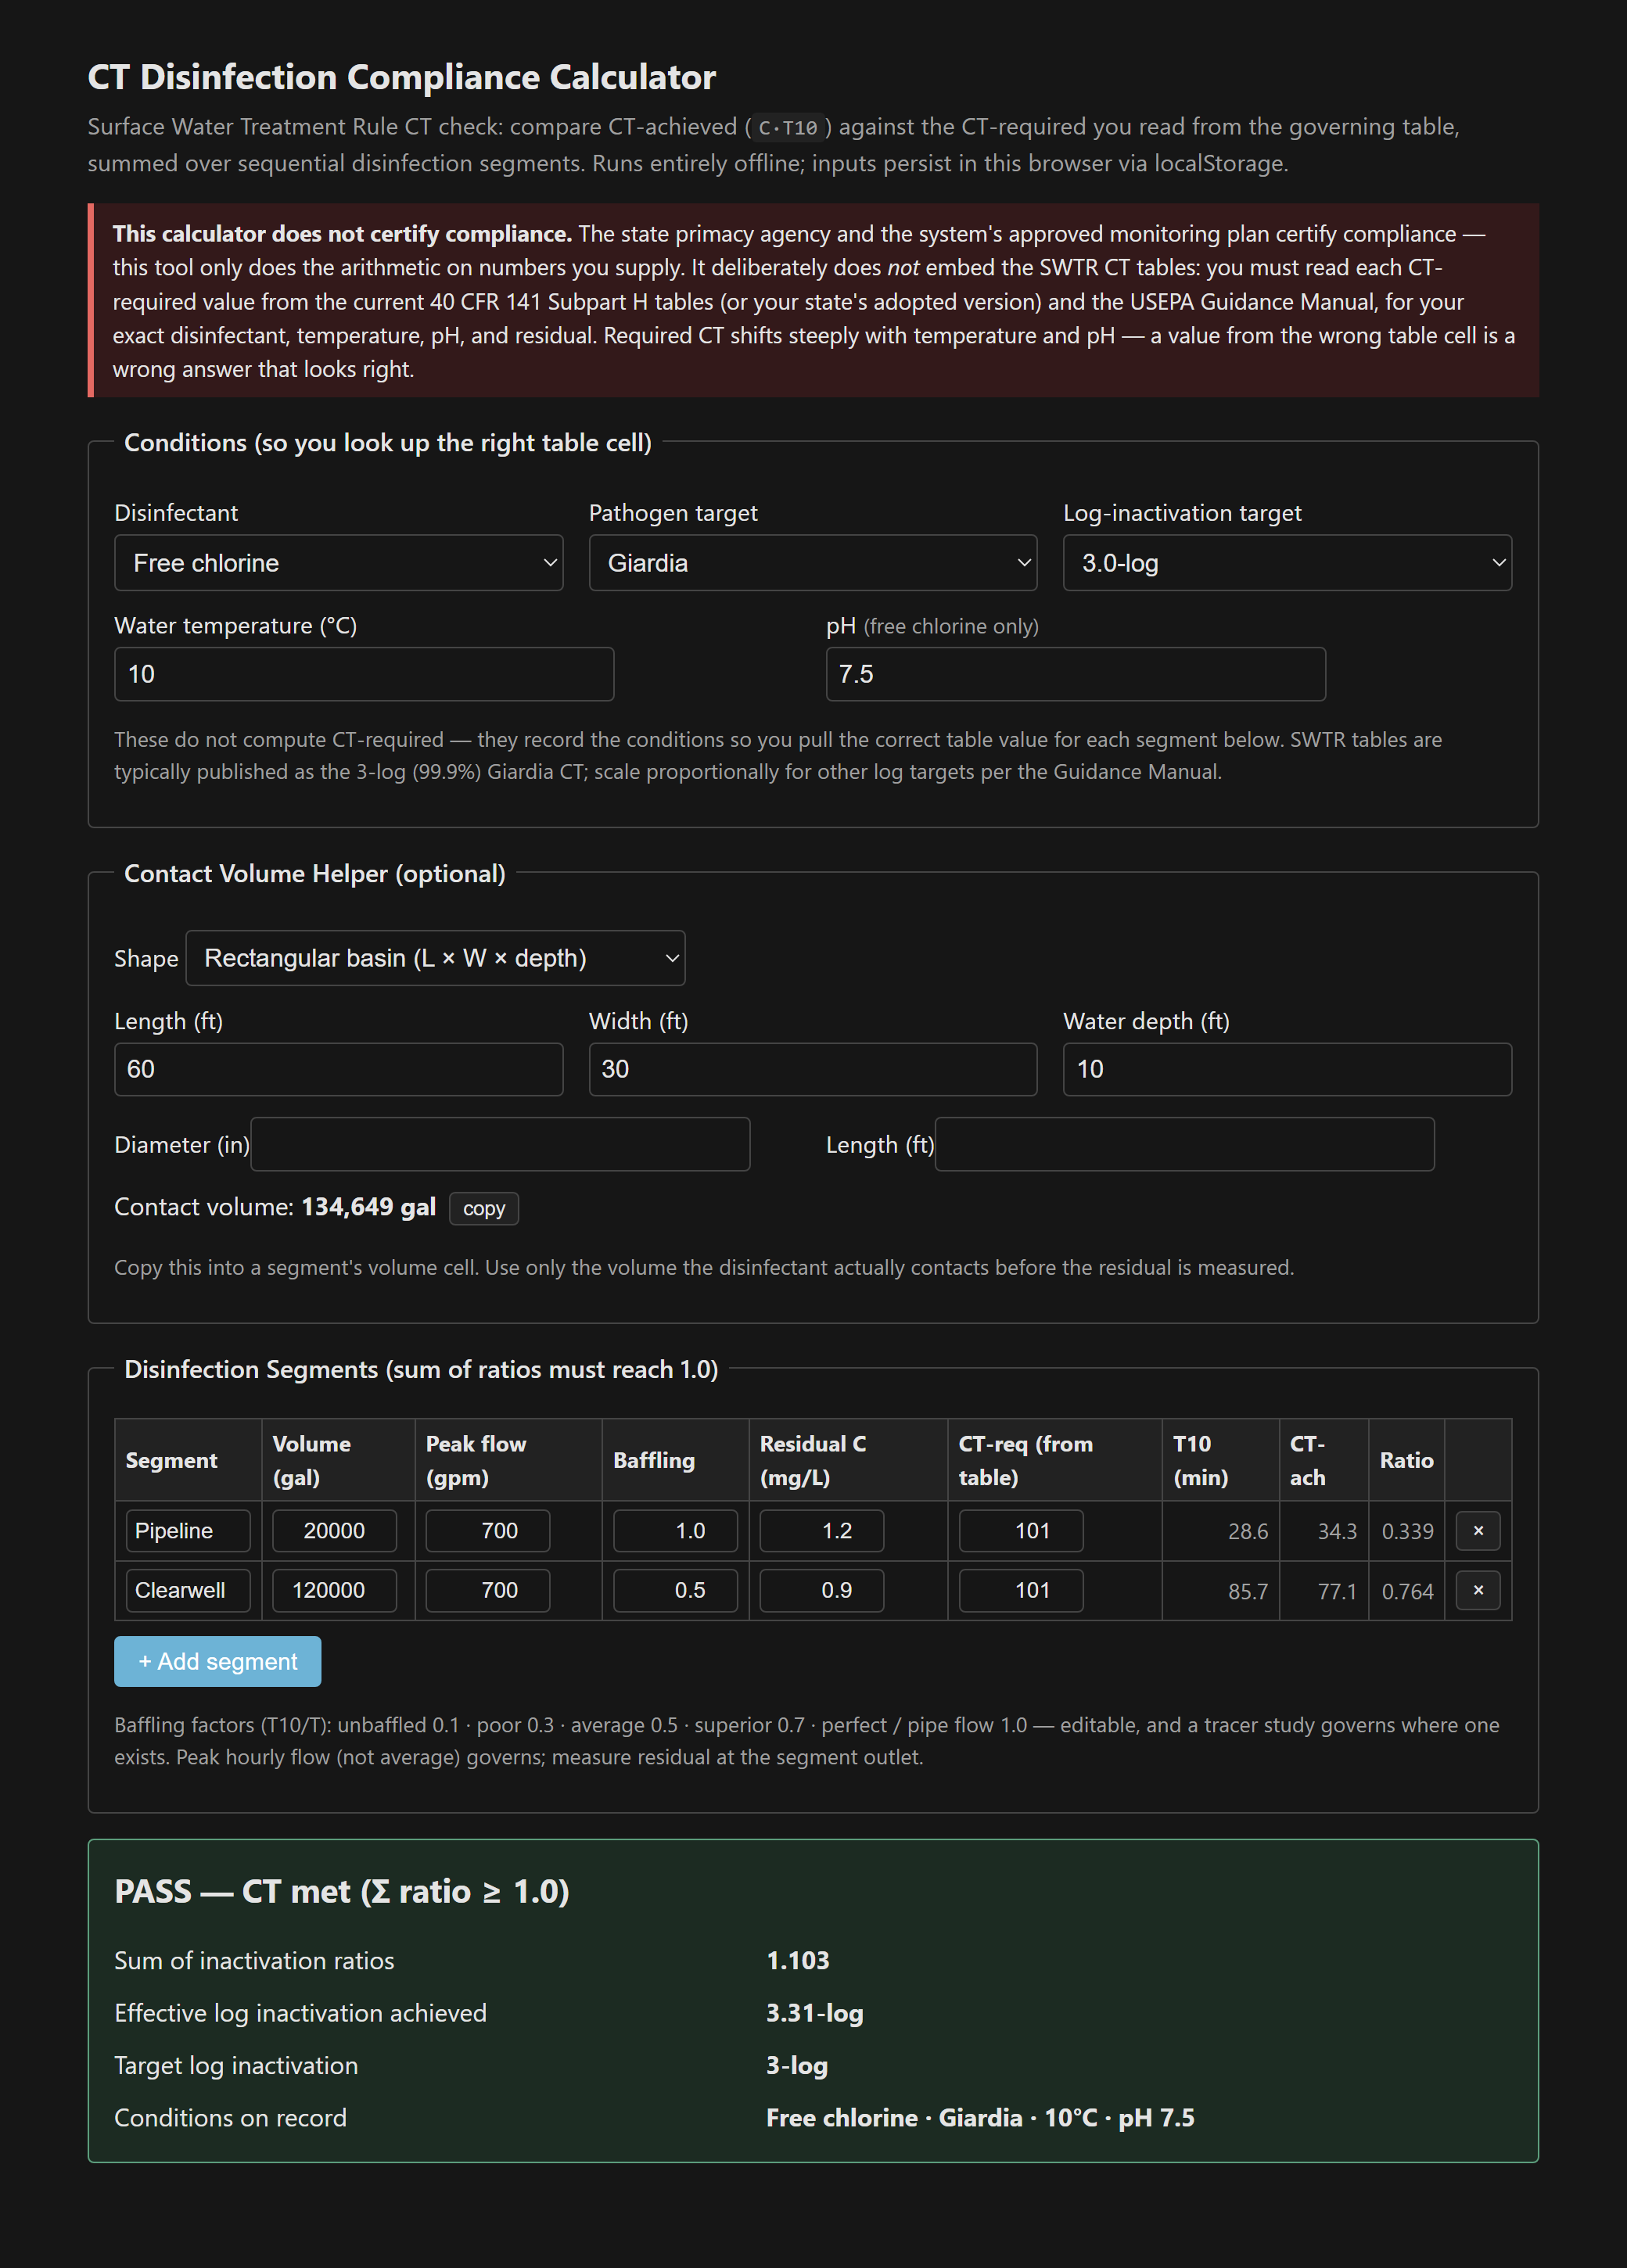
T10 is not detention time, and peak flow is the worst hour
The two field truths the tool is built around. First, T10 — the time the fastest-moving ten percent of the water spends in contact — is the theoretical detention time knocked down by a baffling factor, and that factor is brutal: an unbaffled basin is 0.1, a well-baffled one 0.7, and only a pipe approaches 1.0. Short-circuiting is the norm, not the exception, and the presets here are for planning — a tracer study measures the real number. Second, the flow that governs is the peak hourly flow, not the average day, because the worst case is the busiest hour when contact time is shortest. Size CT on the average and you've certified the plant for a condition it doesn't actually run.
Why the tool makes you enter CT-required
- The SWTR CT tables vary steeply and non-linearly with temperature, pH, and residual. Transcribing them from memory into a calculator is how a wrong value gets institutionalized behind a confident interface.
- Temperature is the big lever: required CT roughly doubles from summer to winter, so a basin that passes in August can fail in February. Profile the cold-water condition.
- Filtration provides most of the Giardia and virus credit; disinfection covers the remainder. Set the log target to the portion your plan assigns to disinfection, not the whole-plant requirement.
- Measure the residual at the outlet of the segment it credits — the concentration that survived the contact, not what went in.
This is arithmetic, not certification. The state primacy agency and the system's approved monitoring plan certify compliance; the tool exists so the arithmetic and the conditions behind it are explicit and on the record. Single file, vanilla JS, everything persisted in localStorage and nothing leaving the browser.
The tool: CT Disinfection Compliance Calculator.
References
- [1] USEPA — Guidance Manual for Compliance with the Filtration and Disinfection Requirements for Public Water Systems Using Surface Water Sources (the CT tables and T10/baffling guidance).
- [2] 40 CFR 141 Subpart H — Surface Water Treatment Rule, and the state primacy agency's adopted version.
- [3] The system's approved disinfection profiling / benchmarking and monitoring plan — governing for what must be demonstrated.