Logging Tracer Study Samples with One-Tap Timestamps
The Problem
A tracer study is two time series that have to line up: chlorine residuals from grab samples, and flow from the SCADA historian. The flow side keeps immaculate time. The sample side is a tech holding a bottle, a reagent kit, and a phone, writing “~10:35” on a wet clipboard — and at analysis time, that reconstructed timestamp column is exactly what the T10 curve hangs on. The weak link isn't the chemistry; it's the clock.
The Approach
The tool is a digital clipboard with one oversized control: a full-width LOG SAMPLE TIME button sized for a gloved thumb in sunlight. Tapping it captures the device timestamp to the second and opens a table row with an empty field for the residual, which gets back-filled whenever the titration catches up. Grab now, type later — the time column stays trustworthy because it was never typed at all.
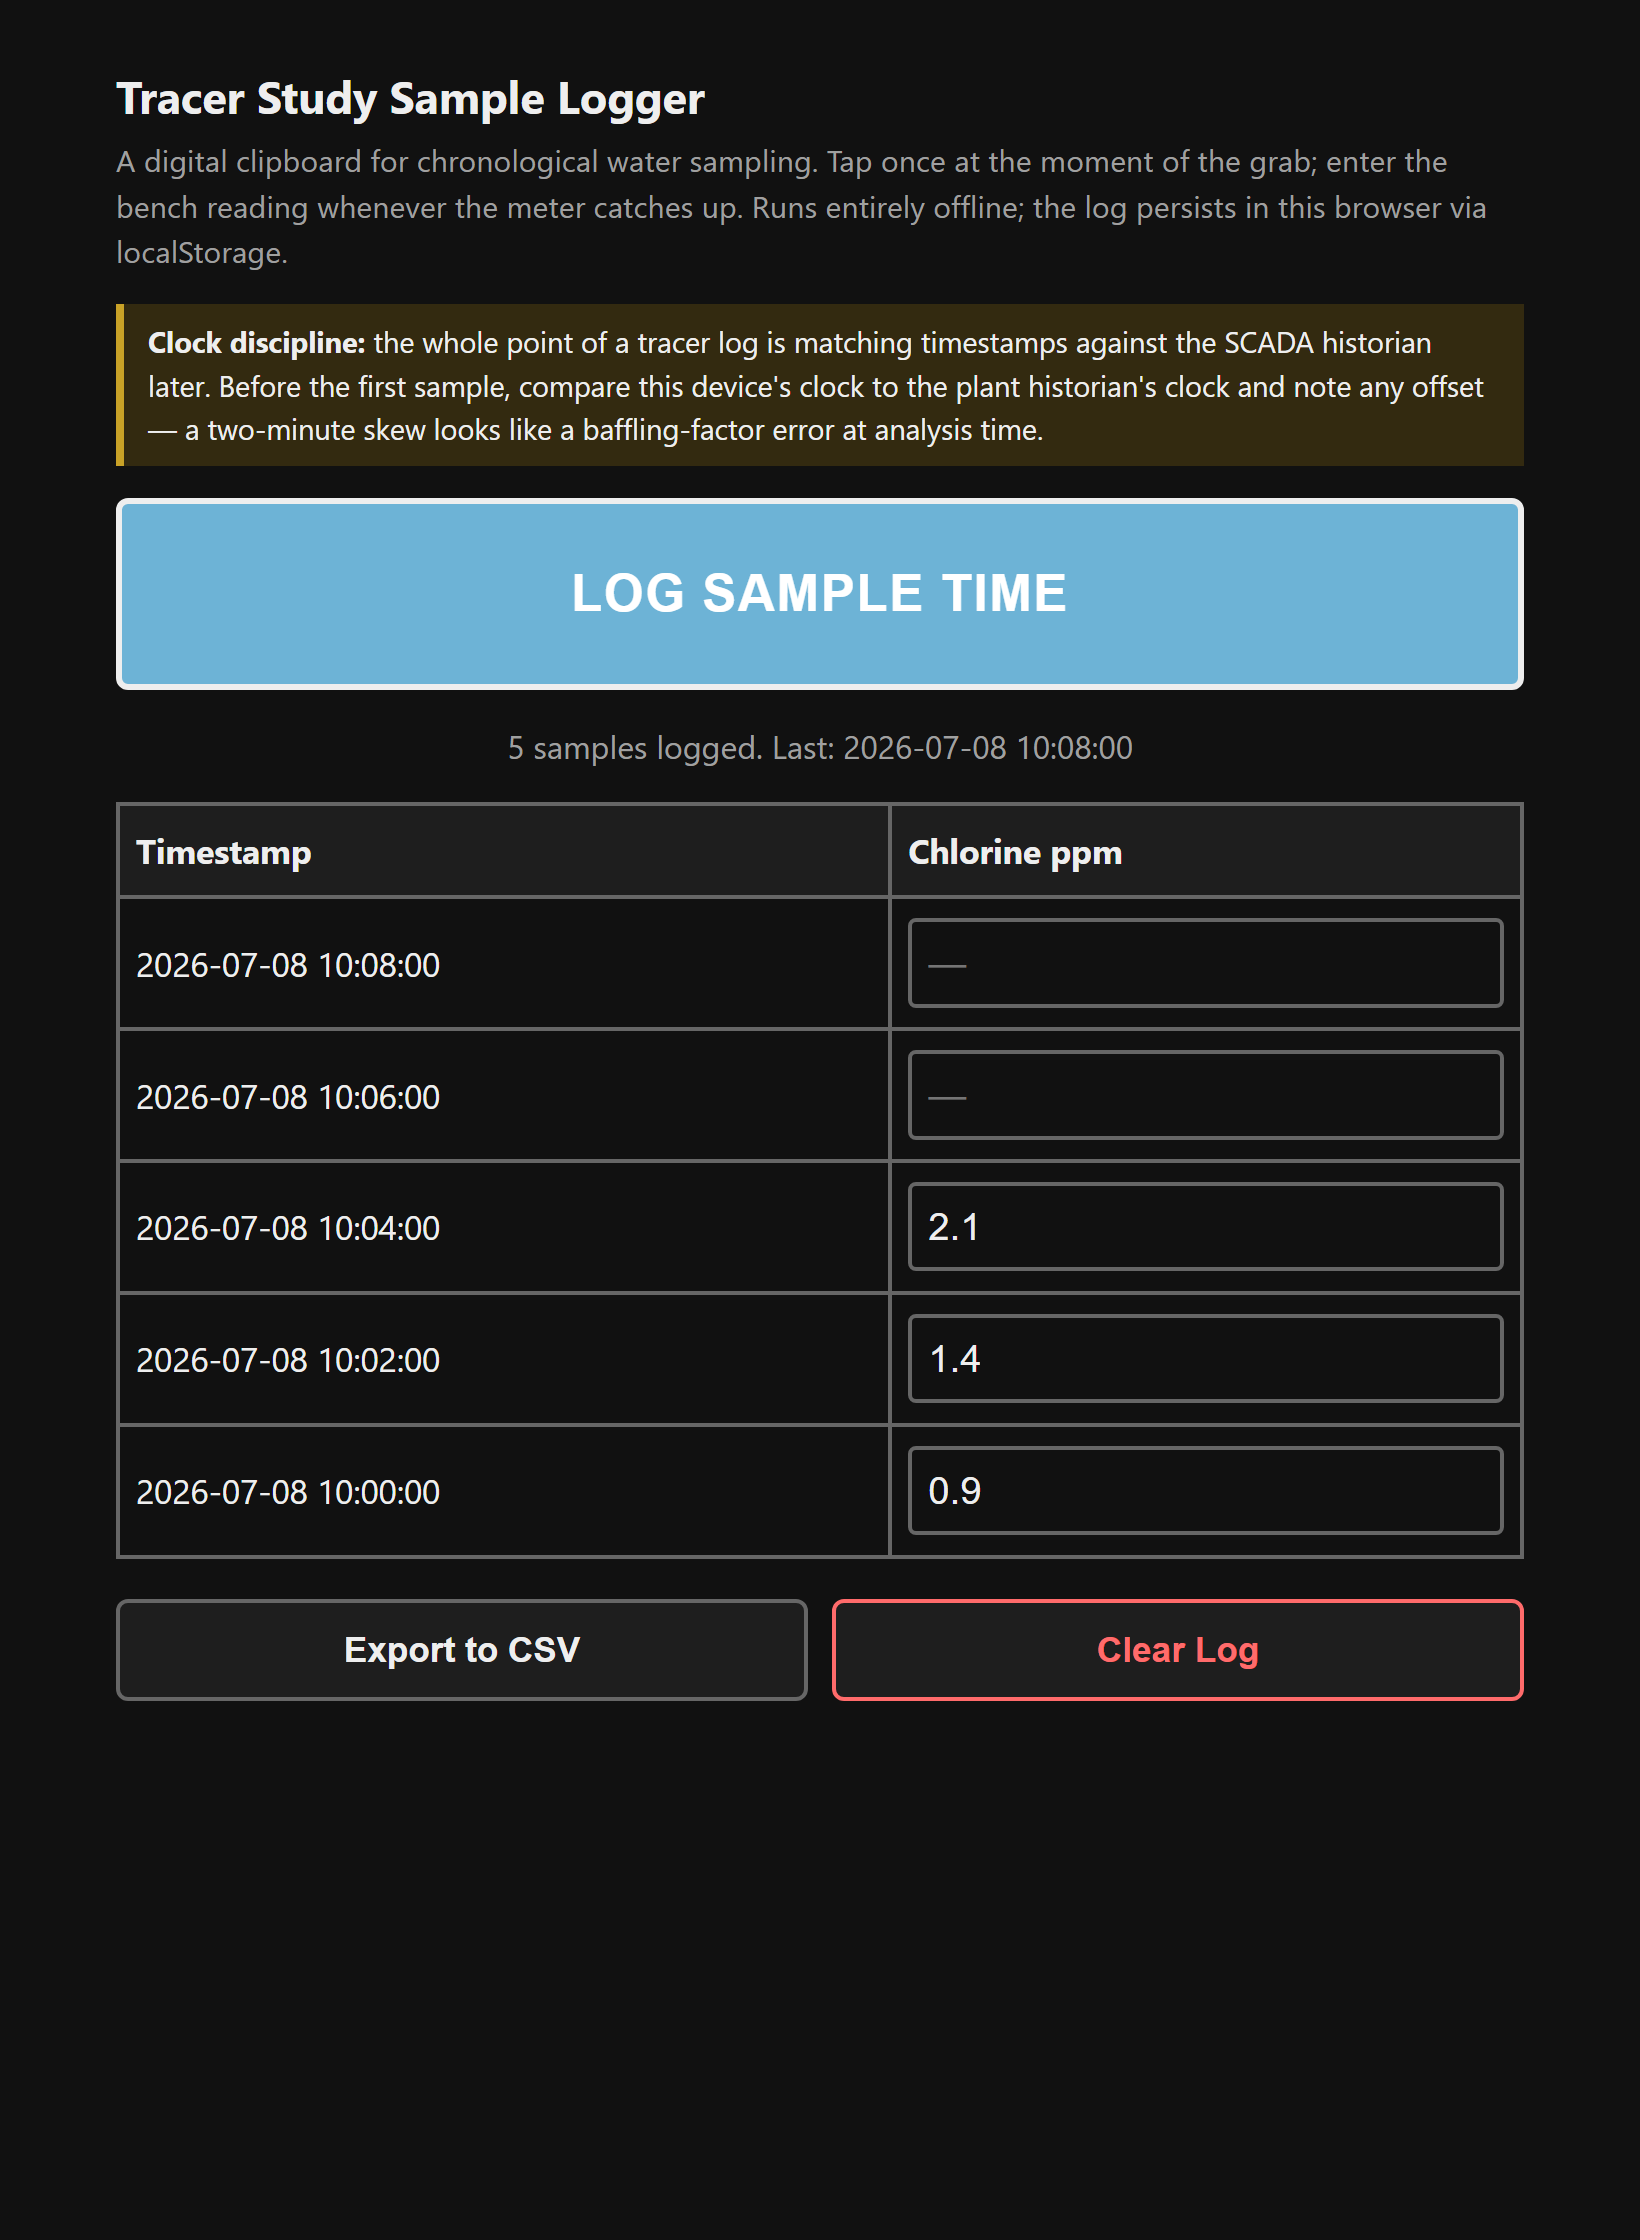
The log persists in localStorage (with a confirm()-guarded clear), and exports to CSV via the Blob API for the join against the historian's flow trend — chronological in the file even though the screen shows newest first [1].
The timestamp bug this avoids
Same lesson as the SWPPP tracker, opposite direction: formatting a JS date with toISOString() renders UTC, which in any US timezone shifts every sample by hours and can shift the date. The logger builds its stamps from local components:
// wrong: renders UTC — 10:35 PDT becomes 17:35 in the log
new Date().toISOString()

// right: local wall-clock time, matching the historian
d.getFullYear() + "-" + pad(d.getMonth()+1) + "-" + pad(d.getDate())
  + " " + pad(d.getHours()) + ":" + pad(d.getMinutes()) + ":" + pad(d.getSeconds())
Clock discipline for the SCADA join
- Before the first grab, compare the phone's clock to the plant historian's clock and write down the offset — a two-minute skew looks like a baffling-factor error at analysis time.
- Sample on a fixed cadence through the breakthrough curve (every couple minutes), stretching out on the tail — the join and the curve both come out cleaner.
- Export the CSV and join on the timestamp column, applying the noted offset as a constant shift.
Single file, vanilla JS, no dependencies, nothing leaves the browser.
The tool: Tracer Study Sample Logger.
References
- [1] EPA Disinfection Profiling and Benchmarking Guidance Manual — tracer study procedure and T10 determination. https://www.epa.gov/dwreginfo/surface-water-treatment-rules
- [2] State primacy agency tracer study protocol, where one governs the facility.