Scaling 4–20 mA Loop Signals, Linear and Square-Root
The Problem
Loop checkout during commissioning is a translation exercise: the meter says 13.2 mA, the loop sheet says the transmitter spans 0–30 ft, and SCADA says 17.4 ft — do those agree? The linear arithmetic is easy enough to do on paper until you're forty loops deep, and then there's the one transmitter type that isn't linear at all and quietly breaks everyone's mental math.
The Approach
Linear is the standard span conversion, which handles elevated and suppressed zeros (LRV ≠ 0, including negative for vacuum or bidirectional flow) since the span is just URV − LRV, signed:
PV = LRV + (mA − 4)/16 × (URV − LRV)
The square-root gotcha
Differential-pressure flow elements are the exception that trips people. DP across an orifice or venturi varies with the square of flow, so when the transmitter sends raw DP linearly, flow is recovered as:
PV = LRV + √((mA − 4)/16) × (URV − LRV)
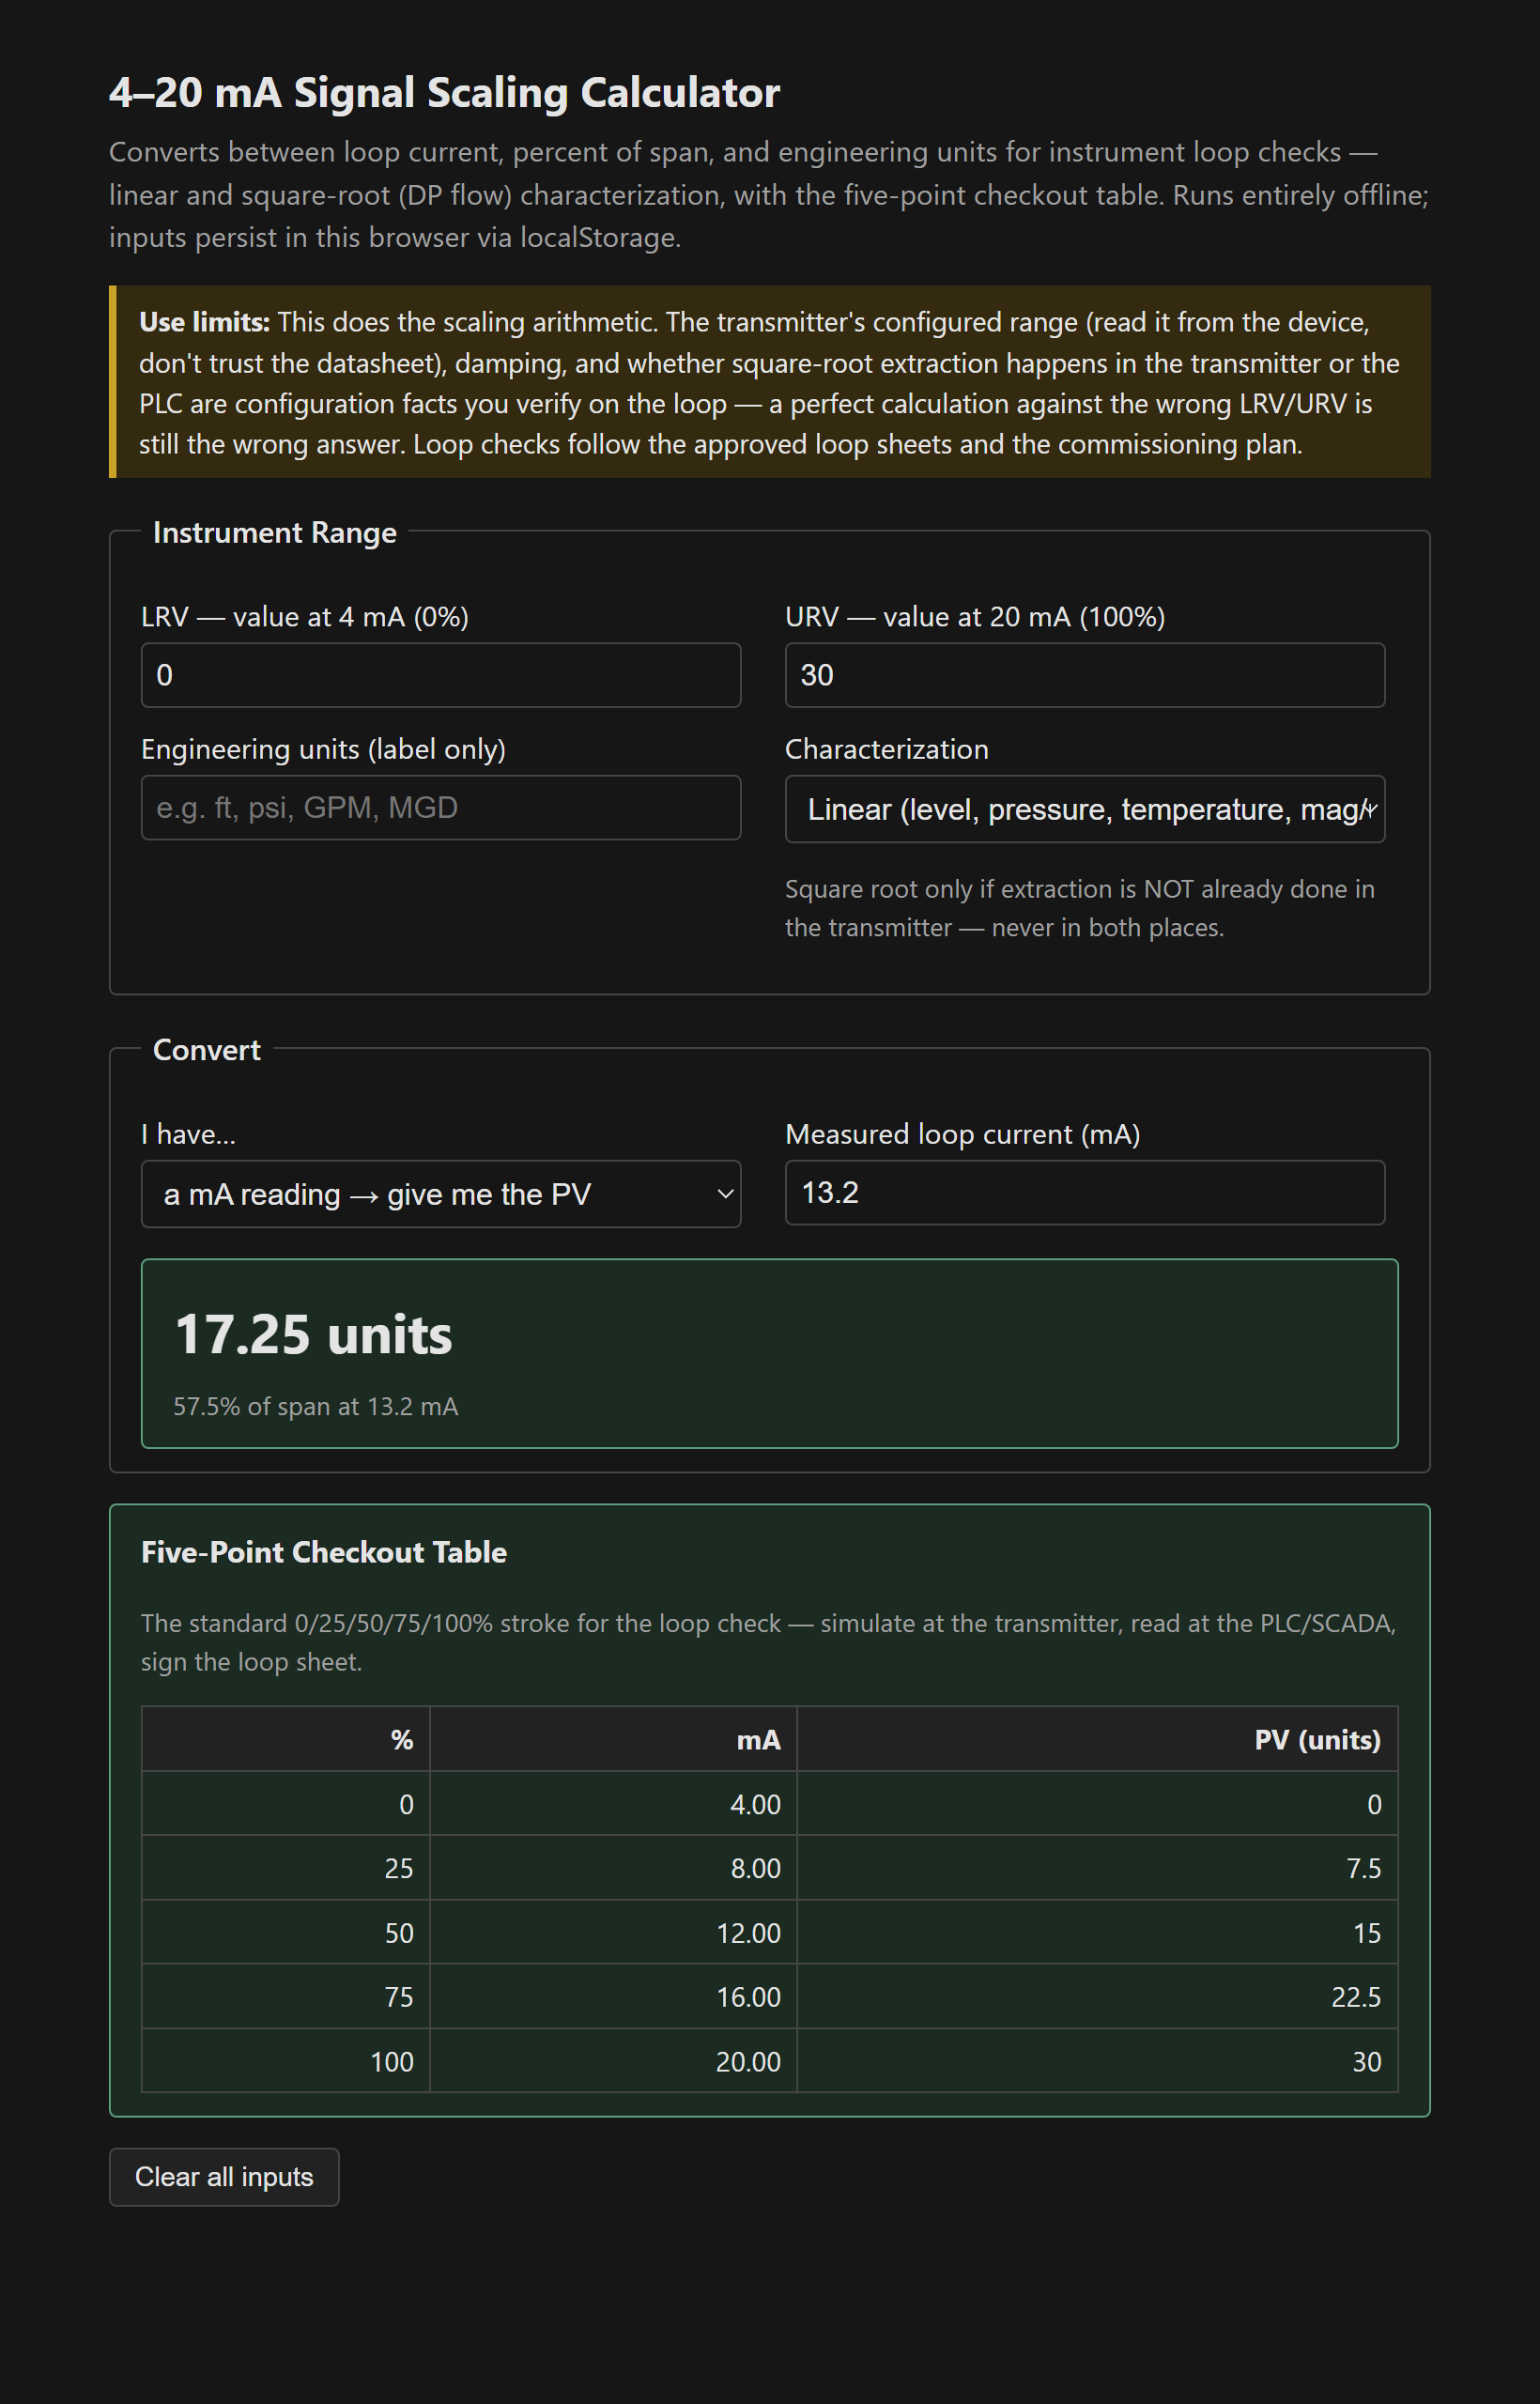
The consequence on a checkout: 12 mA — 50% signal — is 70.7% of full flow, and 8 mA (25% signal) is 50% flow. If the SCADA readback during a loop check matches the linear column instead of the square-root column, the extraction is configured in the wrong place — or configured twice, which under-reads everything below full scale. The tool prints the five-point checkout table (4, 8, 12, 16, 20 mA) in both characterizations so the mismatch is visible in one pass [1].
Fault bands are diagnostics, not data
Readings outside the live range mean something specific under NAMUR NE 43: 3.8–20.5 mA is valid range including over/under-range margin; ≤3.6 mA is the transmitter signaling failure downscale (or a wiring/power problem); ≥21.0 mA is failure upscale; and 0 mA is an open loop — broken wire, blown fuse, dead supply. The tool flags any reading in these bands rather than pretending it's a process value [2].
Field notes from the loop-check trenches
- Read the voltage across the loop's 250 Ω resistor and divide instead of breaking a running loop — 3.000 V is 12.00 mA.
- Confirm LRV/URV from the transmitter's own display or HART, not the instrument index — ranges change during startup and the paper lags [3].
- If SCADA and the field disagree by a consistent scale factor, someone scaled 0–100% where engineering units were expected at the PLC. The five-point table finds it in one pass.
Single file, vanilla JS, localStorage persistence.
The tool: 4–20 mA Signal Scaling Calculator.
References
- [1] ISA-51.1 — Process Instrumentation Terminology (ranges, spans, elevated/suppressed zero). https://www.isa.org/
- [2] NAMUR NE 43 — Standardization of the Signal Level for Failure Information of Digital Transmitters.
- [3] Project loop sheets and instrument index — the governing configuration documents.