The Earned Value S-Curve, CPI Stability, and the 90% Syndrome
The Problem
Earned value is a small amount of arithmetic wrapped around one hard question: how complete is the work, really? Get that number honestly and the three curves — planned value, earned value, actual cost — tell you whether you're ahead or behind and over or under, in a picture anyone can read. Get it from a gut percentage and you've built a very official-looking way to lie to yourself. I wanted a calculator that draws the picture and computes the standard metrics, so the only thing left to argue about is the input that deserves the argument.
The Approach
You enter a budget at completion and, period by period, the planned value, earned value, and actual cost for that period. The tool accumulates and works at the data date — the last period with an EV entry. From the cumulative figures it computes the variances (SV = EV − PV, CV = EV − AC), the indices (SPI = EV / PV, CPI = EV / AC), and the forecast (EAC = BAC / CPI, then ETC and VAC). The S-curve draws planned value the full length of the job and earned and actual cost through the data date, with a marker on that date so the gap between plan and progress is literally the horizontal distance you can see.
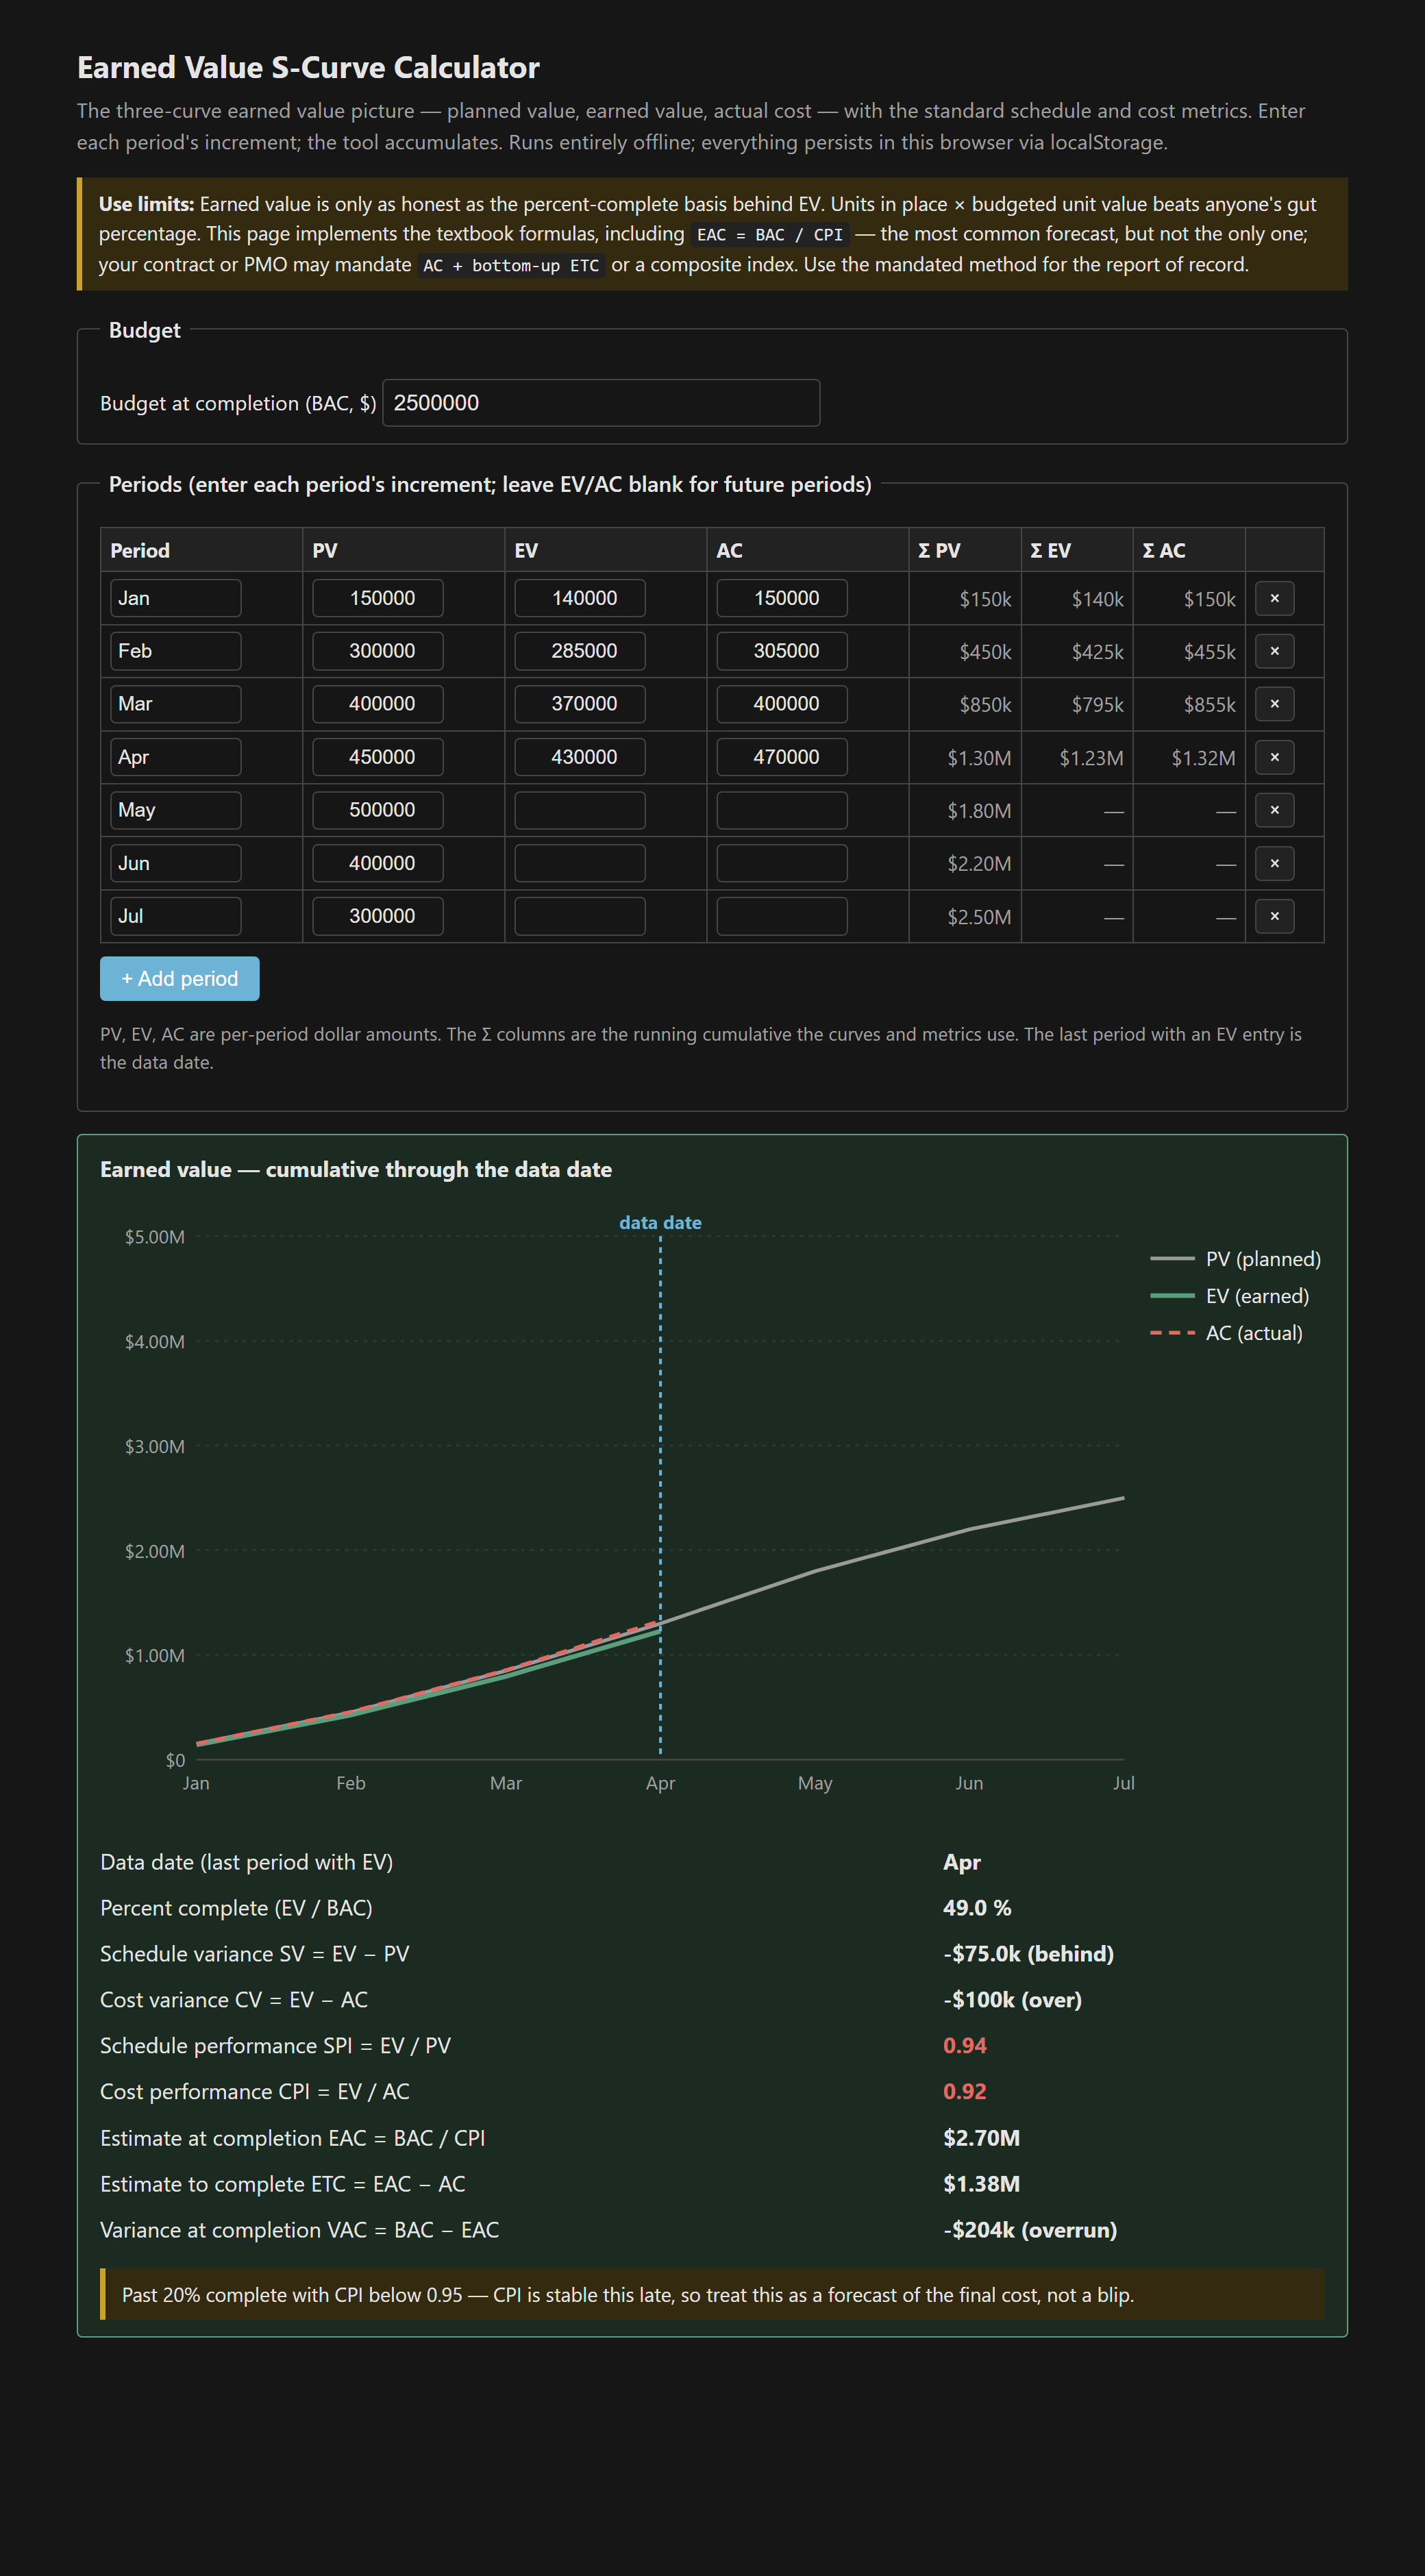
CPI is a forecast, not a blip
The detail worth internalizing isn't in the code, it's in the numbers the code produces: the cost performance index is remarkably stable once a project passes roughly 20% complete [1]. A CPI of 0.92 at the quarter pole is not a bad month you'll claw back — it is, empirically, close to the number you'll finish at, which is why the tool colors it red rather than shrugging. The schedule index behaves differently and more treacherously: SPI drifts back toward 1.0 near the end of any job, late or not, because planned value catches up to earned value as the plan runs out. That's why schedule is better judged on the actual dates than on a terminal SPI.
The 90% syndrome, and choosing an EAC formula
- A project that reports 90% complete for months has an EV basis problem, not a productivity problem. If EV came from quantities in place it would keep moving; if it came from a percentage nobody wants to defend, it stalls at 90.
- Earn value on the same basis you planned it. If PV was loaded by unit rates, earn EV by units installed — mixing bases makes the schedule variance meaningless.
EAC = BAC / CPIis the most common forecast but not the only one. When schedule and cost both hurt,AC + (BAC − EV) / (CPI × SPI)is harsher and sometimes contractually required [2]; late in the job a bottom-up ETC beats any index.- Use whatever formula your contract or PMO mandates for the report of record. This tool shows the textbook chain so you can see how the pieces move.
The percent-complete basis is the whole ballgame, and it lives in your quantity tracking, not in this page — the calculator just does the arithmetic honestly once you've fed it honest numbers. Single file, vanilla JS, everything persisted in localStorage and nothing leaving the browser.
The tool: Earned Value S-Curve Calculator.
References
- [1] PMI — The Standard for Earned Value Management (index behavior, variances, and forecasting).
- [2] AACE International — recommended practices on earned value and estimate-at-completion methods (e.g. 17R-97).